 Football
Expected goals (xG) is a model’s estimate of the probability that a shot becomes a goal, based on features of the chance. It describes chance quality; it does not determine the outcome of an individual shot.
Reading the diagram
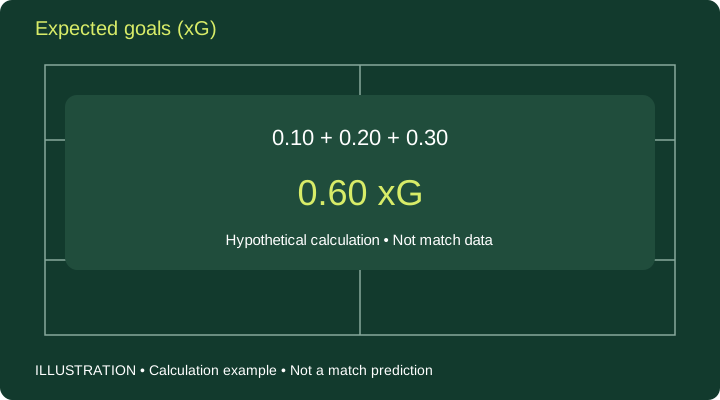
In this hypothetical example, shots worth 0.10, 0.20, and 0.30 xG total 0.60 xG. That is a sum of expected values, not a 60% probability of scoring at least once.
This original FootballCap illustration explains a calculation. The values are hypothetical and do not come from a match or player.
Common misconceptions
Providers may use different features and datasets. Do not treat values from different models as the same scale, or infer finishing skill from one game in which a team outperforms its xG.
Try it yourself
When reading an xG table, note the provider, time period, shot types, and whether penalties are included. Do not assign precise xG values from tactics-board positions.
Keep observations separate from explanations. Test tactical ideas on the tactics board. For metrics, establish the definition and data source before calculating.
Related terms
References
- Hudl Statsbomb — What are Expected Goals?
Source checked: 2026-09-09
Links for further reading; source images, videos, and data are not reproduced.