 Football
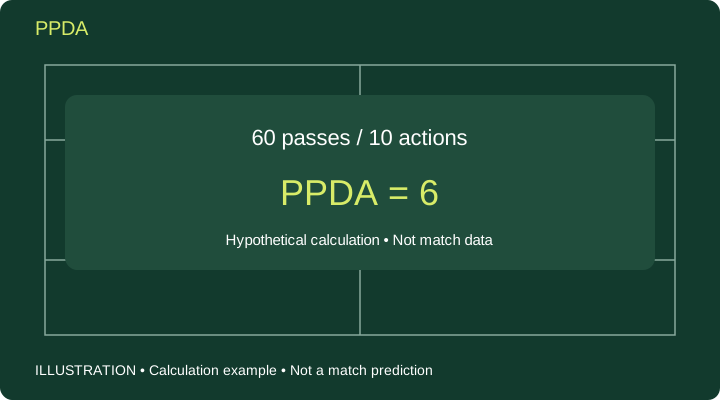
PPDA divides the opponent’s passes by the defensive actions counted within a defined area of the field. It is commonly used to describe pressing intensity.
Reading the diagram
In this hypothetical example, 60 passes divided by 10 defensive actions produces a PPDA of 6. Define the field area and qualifying actions before calculating it.
This original FootballCap illustration explains a calculation. The values are hypothetical and do not come from a match or player.
Common misconceptions
A low PPDA does not by itself prove effective pressing or superior fitness. The score, opponent, possession share, and provider’s zone definition all affect interpretation.
Try it yourself
Compare teams only with the same source and methodology. Also examine where possession is regained and watch video. If the sample contains no defensive actions, do not divide by zero or report PPDA as zero.
Keep observations separate from explanations. Test tactical ideas on the tactics board. For metrics, establish the definition and data source before calculating.
Related terms
References
- Statsbomb — Defensive Metrics: Measuring the Intensity of a High Press
Source checked: 2026-09-09
Links for further reading; source images, videos, and data are not reproduced.